B2B Customer Acquisition Cost: A Founder's Guide
Most advice about B2B customer acquisition cost starts with the wrong question: “What's the average CAC?” That number is usually too blended to guide a decision. A self-serve product, an outbound mid-market motion, and an enterprise sales team don't buy customers in the same way, so comparing their costs as if they share one acquisition engine leads founders to cut the wrong budget.
CAC becomes useful when you treat it as a motion-specific diagnostic. Define the sales motion, channel, customer segment, cost window, and conversion event before calculating anything. Then use the result to decide where to invest, what to fix, and which growth claims deserve more scrutiny.
Table of Contents
- Why Most B2B CAC Numbers Are Misleading
- How to Calculate B2B Customer Acquisition Cost Step by Step
- B2B CAC Benchmarks by Sales Motion and Channel
- CAC Payback and the LTV Relationship That Matters
- A Simple Reporting Template Founders Can Run Weekly
- Where to Cut B2B CAC Without Killing Pipeline
- Putting B2B Customer Acquisition Cost to Work This Quarter
Why Most B2B CAC Numbers Are Misleading
Most B2B CAC numbers are meaningless because founders compare unlike motions. A product-led signup might require a trial, onboarding flow, and product support. An enterprise logo might involve account research, SDR work, sales engineering, legal review, procurement, and executive involvement. One blended ratio hides those differences.
The commonly used formula is simple: total sales and marketing spend divided by new customers acquired in the same period. That formula is useful only when the denominator and cost pool describe the same motion. If you combine self-serve customers with enterprise deals, the average tells you neither whether the product-led funnel works nor whether the enterprise team is productive.
Practical rule: Never accept a CAC number without asking, “For which motion, channel, segment, and cohort?”
Define the unit before you benchmark it
Use this definition: CAC is the fully loaded cost to convert one paying customer within a defined motion, channel, and time window. “Fully loaded” means paid media, relevant salaries, commissions, tools, content, events, agencies, and allocated overhead. “Paying customer” means a closed-won account, not a lead, signup, or marketing-qualified account.
The difference matters. A recent B2B benchmark study followed 153 B2B advertisers, with 90 advertisers traceable into a CRM. It reported a blended acquisition cost of $31,939, calculated as lead-generation spend divided by fair-share closed-won deals created in 2025, with one transactional outlier excluded (Metadata's B2B CAC analysis). The value of that result isn't that every company should target the same figure. It shows how expensive acquisition can look when measurement reaches closed-won revenue instead of stopping at leads.
That result also exposes the underlying problem. Long sales cycles, multiple stakeholders, and heavy paid-media investment can make a closed-won CAC radically higher than a cost-per-lead report suggests. A founder who celebrates cheap leads while the CRM shows weak opportunity-to-customer conversion is measuring activity, not acquisition.
Segment every serious CAC conversation
Create separate views for at least:
- Self-serve or PLG: trial starts, activated accounts, paid conversions, and expansion.
- SMB sales-led: inbound or outbound opportunities that receive sales assistance.
- Mid-market: opportunities requiring discovery, demos, and account-specific work.
- Enterprise: named-account programs, field sales, security reviews, and procurement.
The same company can produce very different CACs across these slices. That isn't a reporting failure. It's the economic reality of different buying processes. The reporting failure is blending them and then using the average to decide whether to hire salespeople, raise ad spend, or shut down content.
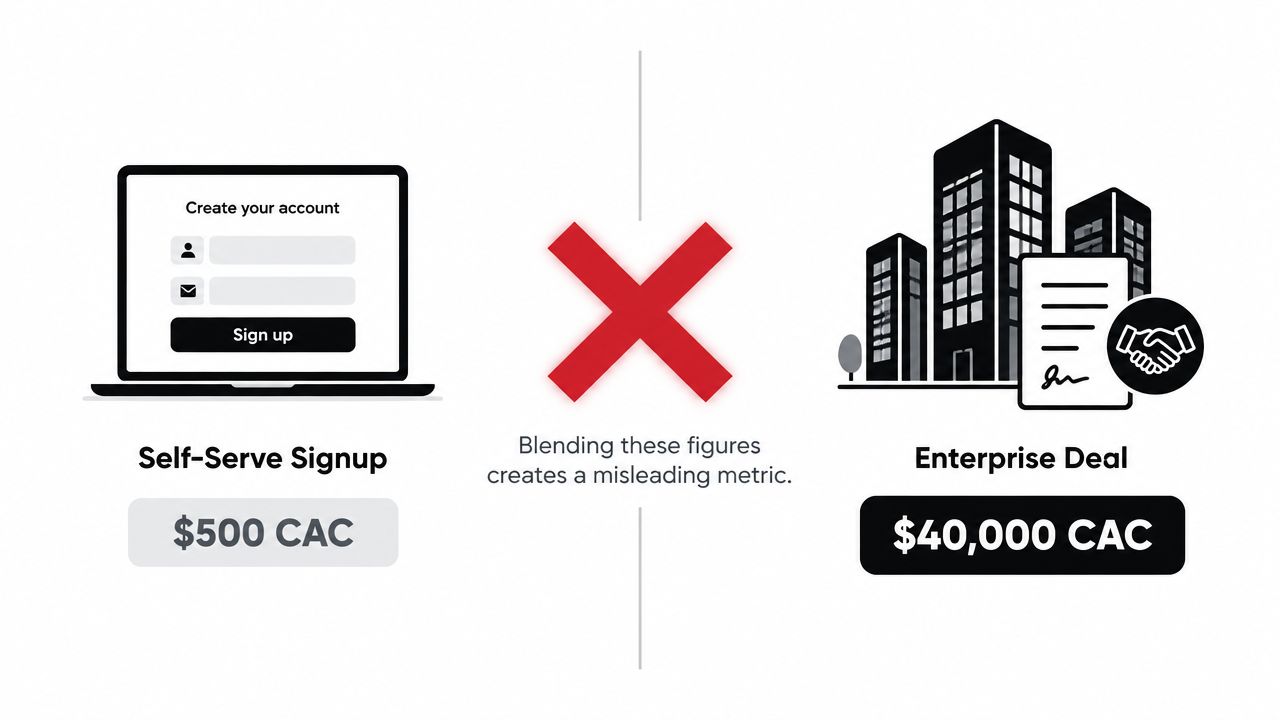
From this point forward, every benchmark needs a label. If it doesn't identify the motion and channel, treat it as context, not guidance.
How to Calculate B2B Customer Acquisition Cost Step by Step
Start with the closed-won customer, not the lead. Suppose a B2B SaaS company spends $180,000 in quarterly sales and marketing costs and closes 30 deals in that quarter. The blended CAC is $6,000 per customer, calculated as $180,000 divided by 30. The 600 qualified opportunities help diagnose the funnel, but they don't belong in the CAC denominator.
Build the fully loaded cost pool
Include every cost that helps create and close new business:
- Paid media: Search, paid social, sponsorships, retargeting, and account-based campaigns.
- People: Fully loaded salaries, commissions, bonuses, and contractor costs for marketing and sales staff.
- Content and events: Writers, designers, webinars, dinners, conferences, and event-specific travel.
- Tools: CRM, marketing automation, enrichment, attribution, sales engagement, analytics, and call-recording software.
- External support: Agencies, freelancers, consultants, and outsourced SDR services.
- Allocated labor: The portion of RevOps, product marketing, customer research, and leadership time devoted to acquisition.
A founder often includes ad spend and salesperson salaries but ignores the rest. That produces a clean-looking number with a dirty denominator. Allocate costs by time, campaign, account list, or a defensible shared-cost rule. Don't allocate the entire company overhead to CAC, but don't pretend acquisition teams operate without infrastructure either.
| Cost Category | Quarterly Spend | Included in CAC? |
|---|---|---|
| Paid media | Actual spend | Yes, for the linked motion |
| Sales and marketing headcount | Fully loaded allocation | Yes |
| Content production | Allocated share | Yes |
| Events and hospitality | Motion-specific spend | Yes |
| Growth and sales tools | Acquisition allocation | Yes |
| Agency and contractor fees | Relevant project cost | Yes |
| General company overhead | Only defensible team allocation | Usually partial |
For a deeper audit of definitions, allocation rules, and denominator choices, use this guide to optimize your CAC formula. You can also use a B2B CAC calculator to make the arithmetic repeatable, but a calculator won't repair missing costs or bad attribution.
Split the result by motion
Take the $180,000 pool and separate it before reporting. If PLG consumed $60,000 and produced 20 paying accounts, PLG CAC is $3,000. If outbound and sales-led work consumed $120,000 and produced 10 accounts, sales-led CAC is $12,000.
That split immediately changes the decision. You might improve onboarding and activation in PLG, while tightening qualification and account selection in outbound. The blended $6,000 figure alone would hide both problems.
Run this split every quarter, then add a rolling view to reduce timing noise. Keep qualified opportunities as a conversion diagnostic, not as a substitute for customers. The question is not how many opportunities marketing created. It's how much fully loaded spend each defined motion requires to create durable revenue.
B2B CAC Benchmarks by Sales Motion and Channel
There is no useful “average B2B CAC” until you name the sales motion. A 2026 benchmark set reports median CAC of $702 for self-serve or PLG, $3,840 for mid-market sales-led, and $11,400 for enterprise sales-led acquisition (Digital Applied's 2026 benchmark analysis). The gap reflects buyer complexity, not merely inefficient advertising.
Another benchmark source lists the same $702 overall B2B SaaS average, with mid-market around $536 and enterprise-focused models at $1,200 to $2,000 (SHNO's B2B customer acquisition statistics). The conflicting ranges are exactly why founders should use benchmarks as directional anchors rather than universal targets. Definitions, cohorts, cost pools, and revenue models differ.
| Sales Motion / Channel | Typical CAC Range (USD) | Primary Cost Driver |
|---|---|---|
| Self-serve or PLG | $702 median | Product conversion and onboarding |
| Mid-market sales-led | $3,840 median | Sales-assisted evaluation |
| Enterprise sales-led | $11,400 median | Stakeholders, sales labor, and procurement |
| Lower-cost B2B channel | $468 per customer in one benchmark | Channel mix and conversion quality |
| Account-based marketing | $4,664 per customer in one benchmark | Target-account research and sales support |
The channel figures come from a benchmark discussion that reports $468 for the cheapest B2B channel and $4,664 for account-based marketing, while also comparing self-serve and enterprise motions (Webtonic's CAC statistics). Don't convert those figures into promises for paid search, LinkedIn, outbound, partners, or organic content. Channel performance varies with ICP precision, offer strength, sales response time, brand demand, and the motion attached to the channel.
Make the benchmark answer a decision
Use the numbers to choose a motion, not to win a spreadsheet argument.
A self-serve product can support a lower acquisition cost because the buyer completes more of the journey without human assistance. Enterprise acquisition can justify a much higher CAC only when contract value, gross margin, retention, and expansion support the investment. An enterprise bet is vanity if the company can't fund the sales cycle or prove that the resulting accounts remain valuable.
Don't double a channel because its reported CAC is low. First ask whether it produces the right customers, whether the figure includes all allocated labor, and whether the next customer costs more than the historical average. The benchmark is an anchor. Your own segment-level payback is the operating target.
CAC Payback and the LTV Relationship That Matters
Raw CAC is a noisy lagging indicator. CAC payback period tells you when the gross-margin contribution from a new customer repays the acquisition investment.
Use this formula:
CAC payback in months = CAC ÷ monthly gross profit per customer
If CAC is $6,000 and monthly gross profit is $500, payback is 12 months. Use gross profit, not revenue. A customer paying $500 per month doesn't contribute $500 to payback if hosting, support, payment processing, implementation, and other direct costs consume part of that revenue.
Judge the cash recovery timeline
A 2026 B2B SaaS benchmark reports median CAC payback of about 16 months, with top-quartile companies at 6 months or fewer and bottom-quartile companies at 24 months or more (Alex Berman's SaaS CAC benchmarks). The same benchmark frames healthy targets as generally under 12 months for SMB and under 18 months for mid-market and enterprise.
That distinction matters by company stage. An 18-month payback may be manageable for a well-capitalized company selling high-value enterprise contracts. It creates far more pressure for a seed company that needs to recycle limited cash into product and distribution. The dollar CAC doesn't tell you that. Cash recovery does.
Use LTV as a companion metric, but calculate it from gross-margin dollars and observed retention. Top-line revenue inflates the apparent value of customers and can make weak acquisition economics look acceptable.
| Sales Motion | Target CAC Payback | Target LTV:CAC Ratio | Common Failure Mode |
|---|---|---|---|
| SMB self-serve | Under 12 months | At least 3:1 | Low-cost accounts with weak retention |
| Mid-market hybrid | Under 18 months | At least 4:1 | Sales assistance without enough ACV |
| Enterprise sales-led | Under 18 months | 5:1 or higher | Long cycles and lumpy churn |
The 3:1 LTV:CAC convention is a useful floor, but don't treat it as a substitute for cohort evidence. A high ratio built on optimistic lifetime assumptions is less reliable than a lower ratio supported by actual retention and expansion. For a practical framework around a sustainable SaaS growth metric, keep the focus on gross margin, payback, and cohort behavior rather than a single headline ratio. A related SaaS marketing ROI framework can help connect channel spend to business outcomes.
Recalculate payback quarterly as pricing, churn, support costs, and expansion change. The rule is straightforward: aim for payback under 18 months and LTV:CAC above 3, then tighten those requirements when cash is scarce or retention is uncertain.
A Simple Reporting Template Founders Can Run Weekly
A weekly CAC report should fit on one page and answer one question: which acquisition motion deserves more money this week? It doesn't need a data engineer. A spreadsheet connected to your ad accounts, CRM, payroll allocation, and finance ledger is enough to start.
Track four blocks for every motion and channel:
- Spend: Paid media, content, events, tools, agencies, and allocated salaries.
- Output: Qualified leads, opportunities, closed-won customers, and new gross-margin dollars.
- Efficiency: CAC by channel, motion-level CAC, blended CAC, and conversion rates between stages.
- Recovery: CAC payback, LTV:CAC, and the direction of each metric versus the prior reporting period.
Segment by motion first, then channel. “LinkedIn” is not a complete unit of analysis if one campaign supports self-serve demand and another supports enterprise account engagement. Your sheet should show whether PLG signups, inbound sales-assisted opportunities, outbound deals, and partner-sourced accounts produce different economics.
| Weekly Line Item | PLG | Outbound | Total |
|---|---|---|---|
| Paid and program spend | Assigned cost | Assigned cost | Sum |
| Allocated team cost | Product-led allocation | SDR and AE allocation | Sum |
| Tools and content | Shared allocation | Shared allocation | Sum |
| New customers | Closed-won accounts | Closed-won accounts | Sum |
| CAC | Motion-specific | Motion-specific | Blended |
Keep the review operational
Flag CAC and payback weekly because they can reveal a broken channel, bad qualification, or sudden conversion problem quickly. Review LTV:CAC monthly or quarterly unless a pricing, retention, or packaging change makes the underlying assumptions unstable.
Don't overreact to one week's closed-won count. Enterprise deals arrive unevenly, so use a rolling view while keeping the weekly report for leading indicators. A spike in spend with no qualified opportunities deserves investigation now. A small movement in LTV:CAC may require more cohort maturity before it supports a decision.
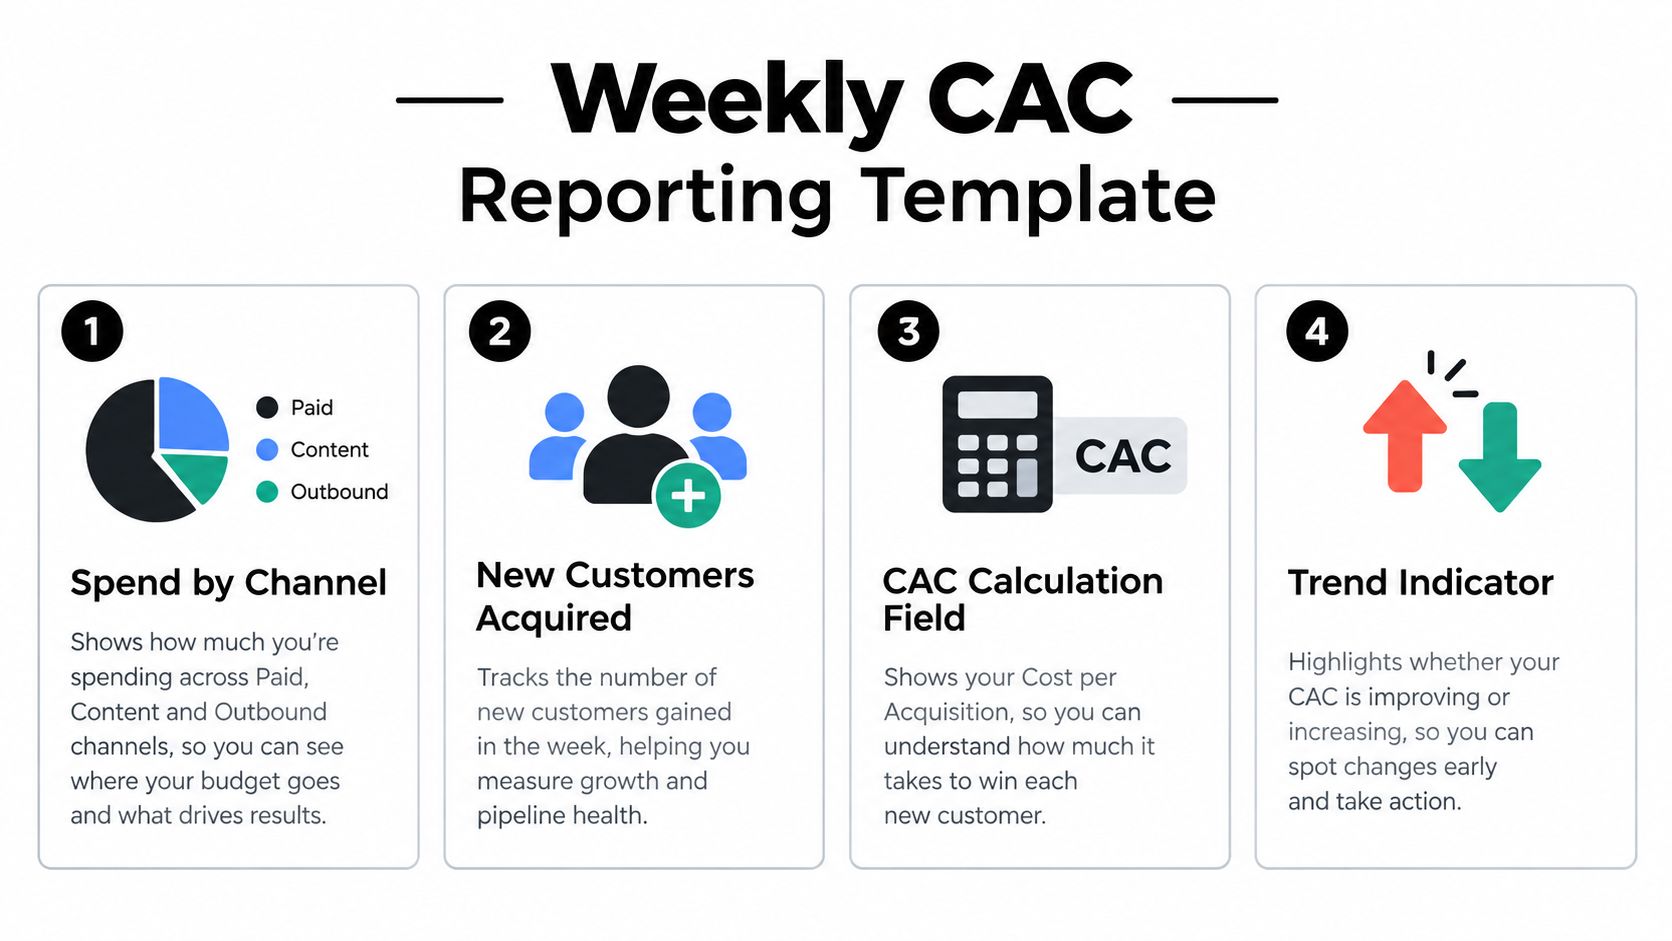
The report should end with an owner and an action. If paid search worsens, name the person reviewing terms and landing pages. If outbound payback expands, identify the qualification or account-list change that will be tested. A dashboard without an assigned decision is just a slower spreadsheet.
Where to Cut B2B CAC Without Killing Pipeline
Cutting CAC blindly usually cuts future pipeline first. Rank the lever by time-to-impact, effort, and stage fit, then run one focused change instead of launching a broad cost-cutting program.
| Lever | Effort | Time-to-Impact | Best Stage Fit |
|---|---|---|---|
| Channel mix rebalancing | Low to medium | Fast | Any stage with channel-level data |
| ICP and qualification | Medium | Medium | Sales-led teams with weak conversion |
| Pricing and packaging | High | Medium to long | Proven product with pricing leverage |
| Retention and expansion | Medium | Compounding | Companies with active customer cohorts |
| Organic content and SEO | Medium to high | Slow | Proven motion with durable demand |
Start with channel mix
Move money away from channels that produce poor-fit opportunities, not merely expensive clicks. Pause campaigns with weak closed-won quality, tighten targeting, and redirect budget toward channels that create customers inside the same motion. This is the fastest lever because it doesn't require rebuilding the product or sales organization.
A lower-cost channel isn't automatically better. If it brings accounts that churn quickly or require excessive support, it can worsen payback even while headline CAC falls.
Improve sales productivity before buying traffic
Tighten the ICP, disqualify poor-fit accounts earlier, improve discovery, and give reps better proof for the moments that stall deals. These changes usually take longer to show up in closed-won CAC because existing pipeline must move through the cycle, but they protect capacity and improve conversion quality.
If payback is over 18 months, fix sales productivity before adding traffic. More leads poured into a weak qualification process create more waste, not more efficient growth.
Use pricing, retention, and content deliberately
Pricing and packaging can lift ACV and gross profit, which improves payback without reducing acquisition spend. The risk is obvious: a price increase without stronger perceived value can reduce conversion. Test packaging around buyer outcomes, implementation effort, usage limits, and support requirements.
Retention and expansion improve the LTV side of the equation. Improve onboarding, identify adoption risks, and create a clear path to additional value before declaring the acquisition channel healthy.
Organic content and SEO are durable but slow. Build them only after the motion is proven, with pages tied to buying problems and conversion paths rather than traffic volume. For a broader set of practical approaches, see this guide to reducing customer acquisition costs. Bazzly can also monitor Reddit discussions and draft context-aware replies for teams testing community-led demand, but measure it by qualified opportunities and customers, not comment volume.
Putting B2B Customer Acquisition Cost to Work This Quarter
By the end of week one, instrument three numbers:
- Fully loaded CAC by motion and channel.
- CAC payback in months, calculated from gross-margin dollars.
- LTV:CAC at blended and best-channel levels, using retention evidence rather than optimistic lifetime assumptions.
Build one board segmented by acquisition channel and sales motion. Each row should show spend, new logos, CAC, payback, and a clear owner. Add traffic-light states so the review produces decisions instead of commentary. Green means the channel is within its approved economic range, yellow means it needs a test or tighter monitoring, and red means spending continues only with an explicit reason.
Run two operating cadences
Hold a 30-minute weekly growth review. Each channel owner reports spend, qualified opportunities, closed-won movement, CAC direction, and the next action. Keep the conversation on changes and decisions. Don't use the meeting to read every dashboard cell aloud.
Run a quarterly motion-mix review as a separate session. Decide where to double down, where to hold, and where to cut. Enterprise, mid-market, SMB, and PLG should each defend their economics on their own terms before anyone discusses the blended result.
Use these triggers:
- Pause a channel when its recent customers miss the approved payback threshold and the owner can't name a credible conversion or qualification fix.
- Increase a budget when additional spend is producing customers in the same motion, marginal CAC remains acceptable, and retention supports the payback case.
- Raise prices or repackage when customers create clear value but gross-margin payback remains too slow.
- Fix the funnel when opportunities are plentiful but closed-won conversion is weak.
- Fix channel mix when pipeline is thin or concentrated in a source that doesn't produce qualified accounts.
- Invest in content only after the sales motion and conversion path are proven.
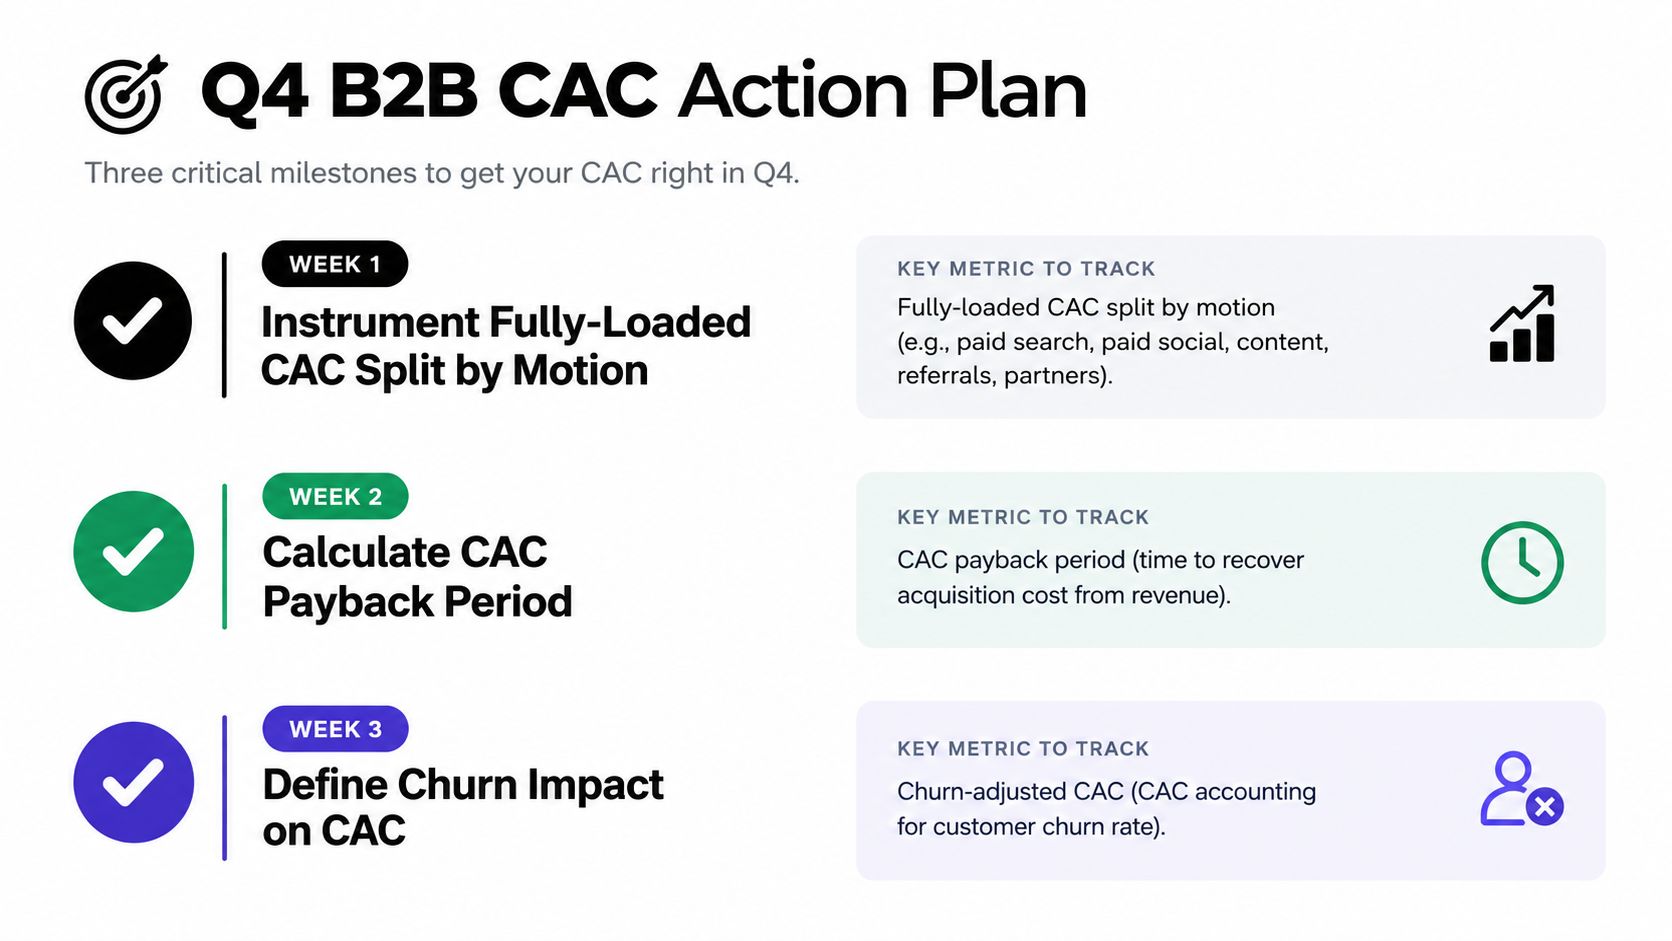
Your Monday action is simple. Open the finance ledger, CRM, and channel reports, assign every acquisition cost to a motion, and calculate the three numbers above. Then choose one lever, give it an owner, and review the result against closed-won revenue and gross-margin payback rather than lead volume.
Bazzly helps founders and small B2B teams automate Reddit demand discovery by monitoring relevant discussions, identifying high-intent threads, and drafting context-aware replies and direct messages. If you want to test a lower-manual-effort community acquisition motion and measure its CAC by qualified opportunity and customer, visit Bazzly.


